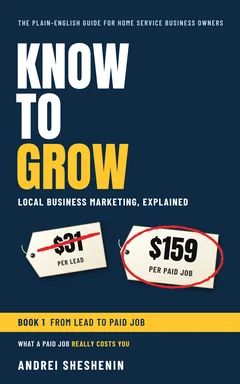
From Book 1: From Lead to Paid Job
by Andrei Sheshenin about 22 min read
Chapter 1: The $31 Lead and the $159 Job
A handyman company I worked with compared its lead sources. On cost per lead, Yelp looked cheapest at $31, and Google's Local Services Ads (LSA) came in at $39.
Then we looked at the cost of a job that was done and paid for. The cheapest paid job came from LSA, at $94. The most expensive came from Yelp, at $159. Regular Google Ads, in the same comparison, came out at $148.
| Source | Cost per lead | Cost per paid job |
|---|---|---|
| LSA | $39 | $94 |
| Google Ads | no figure | $148 |
| Yelp | $31 | $159 |
The source that looked cheapest on the first line was the most expensive on the last.
This chapter is about one idea. The price of a lead is not the price of a customer.
Who sells you what
Google, Meta, Yelp, Thumbtack and every other platform sell you the same thing. They sell you a lead. A lead is a call, a form, a message, a click. Someone raised their hand.
You don't run your business on leads. You run it on jobs that are done and paid for. The platform gets paid for leads or clicks, not for jobs. What happens between the lead and the paid job is your phone, your estimate, your price, your crew. The platform doesn't see that part.
Platforms also report something called a "conversion." It sounds like a sale. It isn't. A conversion is a call or a booking form. One company I worked with was paying about $8.50 per conversion in its ad account. A conversion costs one amount. A sale costs another.
The price ladder
For every source you pay for, there are several prices. Think of them as steps on a ladder.
- Cost per lead. What you spent, divided by the leads you got.
- Cost per estimate or booking. What you spent, divided by the visits and estimates on the calendar.
- Cost per paid job. What you spent, divided by the jobs that were done and paid for.
A few words I use in this book. A lead is a first contact. An estimate or booking is a lead that became a visit or a scheduled job. A paid job, which some people call a deal, is a job that was done and paid for. The close rate is the share that makes it to the next step. Some companies add a step in the middle and call it an opportunity.
A cleaning company I worked with counted opportunities. Google sent the most expensive opportunities, about $100 to $103 each. LSA and Yelp sent cheaper ones. But at the deal step, Google came out cheaper than LSA, where a deal cost $175, and far cheaper than Yelp, where a deal cost $750. The ranking changed between the first step and the last.
There's one more number after these: how many dollars came back for each dollar you put in. People call it ROAS, short for return on ad spend. The question is simple: for every dollar that went out, how many came back?
What is a normal price?
A natural question is, "Is my number too high?" I don't have a single answer, because every company has its own margins. But here are some numbers from real meetings. Each is one company's reality, not a rule. I keep the units separate, because a price per lead and a price per booking are different things.
Per lead
- At one company, $85 per lead in season was acceptable, as long as every source brought a decent return.
Per booking
- If a company needs a lot of volume, it can pay about $100 for a booking. If it can wait and let the campaigns learn, it can aim for about $60.
- One company's result came out at about $156 per booking, as planned: $2,500 spent, 16 bookings.
- At another, 23 Yelp bookings on about $3,300 in spend came to roughly $145 per booking.
- In yet another account, Google was about $154 per booking and Yelp about $140. Google was the pricier one there, but it was still part of the mix.
An expensive lead can be a good lead
A security screens company said its leads cost about $100, with about one in three closing. I told them that if that holds, they should step on the gas until a lead costs $150, because those leads pay for themselves. The math behind a limit like this is in "Where your own limit comes from" below.
At the same company, one campaign was the most expensive they had. A lead cost $170. It still produced, and the salesperson was happy with those leads. When the campaign was turned off, sales dropped around the same time. Whether one caused the other is something to test by turning it back on.
Markets matter too. In one saturated market, a lead cost about $170 and converted well. In an untapped one, it cost $27.
And platforms differ in the kind of buyer they bring. In one account, Google leads cost more than Facebook leads but were better leads.
What a lead really costs when you only work some of them
A company told me its Yelp leads cost $20. But they took only about one lead in four. So a usable lead cost them $80, not $20.
Then the job. A job was $140, and the company kept about 40% of that, about $56. Put $56 next to an $80 lead, and the lead was losing money.
And at another company, about 70 leads came in and nobody could convert them. A lead you can't work is paid for and wasted.
Qualified leads
Not every lead is worth counting. At one company, counting only qualified leads showed that the Google Business Profile delivered for the money spent and Facebook was weak. At another, I said: if 90% of a campaign's leads don't qualify, shut it down and start another with different ads. At a third, the cost per qualified lead was about $32 on LSA, about $21 on Thumbtack (but low quality), and about $100 on Yelp.
Some calls aren't worth taking at all. A $50 call to caulk one small gap is one example.
Two cautions. First, lead quality needs feedback from the sales side. Marketing alone sees only monthly totals and can't tell a good lead from a bad one. Second, leads from outside your service area need a test. Follow them through to the sales team. If they close, keep the broad targeting. If they don't, separate them.
At one company, my guess was that at least half of the repair calls weren't showing up as ad leads. If you count cost per lead only on leads you can trace, the number can mislead you.
Margin, not revenue
Judge a source by what's left, not by what it brought in.
One company put $5,000 into a campaign and got $6,800 back. But after paying the workers who did the jobs, the campaign was a loss.
It's the same with job types. At one company, we looked at the margin left after parts and labor, not at the price of a job. At another, the real question was which job types to aim for. Whether a division is profitable depends on how much ad spend is attributed to it. Electrical, for example, had no campaign of its own, so its ad cost looked small. And it helps to plan leads and appointments for each product category, so you can see which spend to raise or cut.
At one company the reasoning was that sales might drop by $2,000 to $4,000 while the ad bill fell by $8,000. And at one company, $4,000 in ads against $120,000 in monthly revenue was already a great position to be in. The issue there was knowing which source deserved the credit, not the return.
Where your own limit comes from
How much can you pay for a lead? The answer comes from your margin and your close rate, not from an industry average.
This part is my reasoning, and the numbers are made up to show the math. Say you sell a $5,000 job and keep $3,000. If you close one lead in three, you could pay up to about $1,000 per lead and break even. That's the limit: pay more and you lose money. If you close one in ten, the limit falls to $300. You want to be well under the limit, not at it.
A company that closes more, or keeps more from each job, can afford to pay more. That's why "step on the gas until $150" can be right for one company and wrong for another.
Conversion is what counts, not the number of leads
Spend against return is the simplest test. Here are some real pairs.
- $12,000 brought in about 200 leads and 30 deals, roughly $400 a deal. In earlier months there were 300 leads and only 24 deals. The month with fewer leads was better.
- 33 Google leads turned into 14 won jobs. 54 LSA leads turned into 2 booked jobs.
- At another company, Google produced 13 deals against 7 from Facebook.
- At a premium remodeling company, workshops and Facebook leads were cheap compared with Houzz and Google. But Houzz and Google brought in at least ten times as many contracts, and the home show was also among the most productive.
- In one account, Google brought fewer leads, but the biggest-ticket customers came from Google.
- One company spent $2,600 on Google Ads and got $2,800 in business. I said the channel should be shut off. In the same account, handyman work had $4,000 spent and $28,000 back, and we kept it.
- LSA brought in about $25,000 on about $2,000 in spend. Yelp brought in about $6,000 on $1,500. My comment on Yelp was that for now it looked weak.
- Another company: $1,000 spent and more than $2,000 earned, so it stays. $600 spent, a few unclear calls, so it wasn't worth running yet.
- A Google Business Profile campaign with $1,000 spent brought in six paid deals. Facebook had three deals at an unclear stage. Compare deals per dollar.
Why is a return of twice the spend enough at one company and four times the spend weak at another? Because of what's left after labor and parts. Work out your own limit with the math in "Where your own limit comes from" before you copy anyone's verdict.
Not every weak line needs to be cut. At one company, appliance repair on Google was roughly break-even: $530 spent, 7 leads, 4 jobs worth about $1,400. The move was to pause it and shift to electrical, where there was capacity. At one company, some markets were still profitable, so I said there was no need to cut everywhere, only to shift toward the best market. At one company the cut was a video campaign in one region where there were conversions but the ticket size didn't justify the cost.
At one company, the handyman line got about a third of the plumbing budget and returned twice as much. The idea was to raise it carefully, to one and a half or two times what it was.
A cheap average can hide an expensive mistake
One company looked at the average ticket across all of its work. I told them: you're taking the average temperature of every patient in the hospital. The number is real, and it tells you nothing about any one patient. The right move was to look at each service, see which one kept bringing in only cheap leads, and turn that one off in that source.
Lead prices differ by service. In one account, handyman leads ran about $20 and plumbing leads about $50. If you mix them, you argue about a number that is true for neither.
So split the numbers. A company with four sources and four services has sixteen combinations. Inside Yelp, split the budget by service, so you see the cost per lead and the return for each service and not one blended number. In one account, Yelp brought in about 5 jobs for about $2,000 on HVAC and about 10 jobs for $3,000 on electrical.
The same is true inside one platform. In one account, the cost per lead on LSA ranged from $58 to $167. A lead from a Google Business Profile campaign ranged from $8 to $40. "Google" isn't one price.
Do platforms cost the same?
Sometimes they land close together. In one account, a lead cost about $185 on one Google product and $183 on another. In the accounts I worked with, when LSA was linked to the Google Ads account, its lead price tended to end up close to the Ads price, within about 3%. That's what I saw, not a rule. Either way, the real difference is in conversion.
In other accounts the prices were far apart. In the account from "Qualified leads" above, a qualified lead cost about $21 on Thumbtack and about $100 on Yelp. In another, Google was $35, LSA $50 and Yelp $41. When they differ, look at conversion first.
When you compare LSA with search ads, decide on revenue per source, not cost per call.
There's one more thing I've seen with LSA. In the accounts I worked with, it used to bring in the best leads, with a conversion rate about eleven times that of Google Ads. Lately, at four or five of the businesses I work with, callers from LSA only ask for a price and don't book. I don't know why. That's what I saw in my accounts, not a fact about the platform.
A note on timing. The LSA numbers in this book come from the accounts I worked with at the time. Platforms change these products often. Check how LSA is set up in your own account today.
Put Your Money Where the Fish Are Biting
You've learned to read the price of a paid job. This part is about what to do with it: where to put the next dollar, when to cut, and where the real problem is. The idea comes from fishing. Fish bite in some places and not in others. Drop your line where they're biting.
Where the fish are biting
At one company handyman work returned about ten dollars for every dollar each month. My advice was to keep adding until it stopped biting.
If you aren't sure, test small. I told an owner that a region that had returned no revenue should get a small test budget of about $200 a week, and that we'd scale only when the money came back.
One company spent $62,000 to $68,000 from June on and sold about $511,000. In August, when the ads were off, sales collapsed.
Compare markets by return
A lead count tells you little about a market. Return tells you more.
At one company, a month with about $40,000 in ad spend brought about $500,000 back in one market. At $45,000 the expectation was about $600,000. The first is a result, the second a forecast.
Compare that with another case. A big market produced 65 leads, somewhere between 9 and 21 estimates, and one sale. A smaller market produced 53 leads and 24 estimates. I said we should spend about a third as much in the first and move the money to the second. In another case, a market with 77 leads produced only three estimates.
At one company, 94 cheap leads from a market without a sales rep brought about $50,000 in sales, maybe less. I said to concentrate where you can get in front of the customer.
The cost of putting money in the wrong place is real. One company spent about $20,000 on plumbing ads. That money in handyman work, where the numbers were better, would have returned about double. In another case, $5,000 in a weak market bought three leads. The same money in a strong market would have bought 20 to 25. And one company found that the same $3,000 to $4,000 returned far more in its core line than in newly opened lines, so the owner closed the new lines and put the money back in the core.
One more case. A lead in one market cost about a quarter of what it cost in another. The cheaper market closed $100,000 against $200,000 in the expensive one, on far less spend, so there was room to grow it.
Cut without losing leads
Here's what happened at three companies.
- One company went from $25,000 to $12,000 and kept the same number of leads. It had cut everything except Yelp, because the other sources were losing money. Yelp was the most expensive source at the company that opens this chapter, and here it was the one worth keeping. That's why you check your own numbers.
- Another spent about 75% less and kept getting about the same number of real leads. Most of the earlier ones had been spam.
- A third spent almost half as much as before and still got more leads than last year.
These are three companies. They aren't a promise. The way to find out is to look at the cost per paid job for each source. Chapter 5 looks at more accounts where the budget was cut.
At one company the repeat customers carried the losing channels, so the total came out near zero. Cutting those channels would make it very profitable.
If your spend went down a little and the number of leads stayed the same, efficiency improved. That's worth noticing.
At one company I thought we could cut about a third of the Yelp categories and about 40% of the budget, ideally after looking at several months of data.
Cheap leads and noise
Cheap leads are tempting. One company ran a broad campaign across the whole country and paid about $14 per lead: 79 leads for $1,100. I kept it running, because every once in a while a diamond turns up. The test is what closes.
But a lot of cheap leads can also hide noise. At one company, the number of leads rose and the number of quality leads fell. At another, 100 of last year's 346 leads came from one marketplace, and I suspected they might be junk.
Inside Yelp, I proposed analyzing by appliance category, because some categories can bring in inquiries without jobs, and you pay for them. When the budget isn't split by category, in my experience Yelp burns through it. At another company the plan was to let Yelp choose the categories to get cheaper leads, and I said to check the result by paid jobs.
When the lead is fine and the problem is somewhere else
Sometimes the money stops after the lead.
At the security screens company from earlier in this chapter, one out of ten estimates became a sale. Either they were selling wrong, or something was wrong with the estimate. At another company, 15 to 20 leads came in a month and sales were close to zero. I suspected the salesperson.
At a third, a plumbing line had a $10,000 budget, 50 estimates and only $3,500 in revenue. The problem was selling that service, not the ads.
At one company, about 30% of 14 estimates closing was normal, as long as the numbers were counted very carefully. And the close rate depends on who is selling in that region.
Sometimes the company can't reach the customer. In one market a lead cost $27, and the owner held back, because the team couldn't handle more. In another, the leads came in and the estimates were decent, but wherever the salesperson couldn't go, the sale rarely happened.
Do not panic when the price goes up
A rising lead price isn't always a problem.
A new campaign needs time to learn. I told one owner to let it run and learn, and it would get better. At another company, I expected the price to fall as the campaign matured. And sometimes the price is high because you're winning. One LSA account was expensive because the company was winning the auction and showing up at the top. In that case, as I read it, the price reflected winning the auction, not poor lead quality.
The question isn't whether the lead price went up. The question is what you pay for a paid job, and whether that still makes money.
Start with the biggest channels
I start with the sickest of the biggest channels, because they carry the weight. Once they're working and things have calmed down, we dig into the smaller ones.
What Can Fool You
You now know how to read the price of a paid job and where to put money. This part is about the things that make a good number look bad, and a bad number look good. Time. One big job. Referrals. And how you count.
Judge the money after the lag
The money doesn't arrive in the month of the ad.
The big jobs show up one, two or three months later. One company showed a month where about $21,000 was spent and $158,000 was sold and scheduled. Another counted about $150,000 closed, including earlier sales, against $17,000 in spend, with 36 more leads still in the estimate stage. Mid-month numbers are drafts.
There's also a compounding effect. Most leads stay in the pipeline and buy later, which gives a multiplier in the months that follow. In one case, $10,000 in sales on $1,000 in spend was described as a ratio that works.
At one company, Meta was judged by cost per estimate, about $45, and cost per deal, about $325. Mid-month those numbers were provisional.
One big job can hide a weak month
Big jobs make months lumpy.
At one company, a single $198,000 job came through Google Ads. Without it, sales would have been below $100,000. At another company, an HVAC job of about $30,000 paid for a whole month of ads. At a third, a big job came in about once every three months and paid for everything that had been spent. At another, deals of $20,000 and $10,000 covered about three months of a cheap secondary market.
That's wonderful when it happens. It's also a mask. Look at a window of several months, and ask what the month would look like without that one job.
Ads work indirectly
At one roofing company, most deals showed up as coming from referrals. But as soon as ads were turned off, the referrals stopped too. It felt as if people remembered the company because of the ads and then called.
At the same company, without ads they got about 60 leads a month. With about $30,000 in ads, they got about 200 leads in total. That's how to look at it: count the extra on top of the baseline. Here that was about 140 extra leads for about $30,000, about $214 each.
People who already know you
At one company, about half of all revenue came from people who already knew them. At a niche shop, about two-thirds came through referrals. Everything new you buy has to be judged against that base, because it can quietly carry channels that lose money.
Big jobs, small jobs
A repair and a re-roof aren't the same lead. At one roofing company, repairs converted at more than 25%, and I needed to know the lead price for repairs and for re-roofs separately.
A lead can also hide its size. One person wants to try one door. Another wants the whole house. It's very hard to tell them apart at the ad stage.
For large jobs, the lead is expensive. At one premium remodeling company, a Facebook lead cost about $1,300, a Houzz lead about $1,700, and a Google lead was $2,000 in May and later $1,100 to $1,200. Free, organic leads became the cheapest of all.
Customers who pay many times
Some businesses sell to a customer who pays again and again. At one turf company, the team could count money only through the invoicing software. They couldn't track a customer's lifetime value, because people paid on a recurring schedule. Their point was that once the lead sources were set up correctly in that software, they'd see the metrics they needed, like return on ad spend.
If you sell something that repeats, count the customer's value over time.
Whose count is it?
Before you compare numbers, agree on how to count.
One company decided to count only jobs created in that month. It also separated jobs that never became sales from jobs with revenue: 36 jobs had brought in nothing. At another company, marketing had the cost of an appointment falling from about $1,000 to under $500 over the past year, while the owner, counting staff, put it at $1,200. One company could count money only in its invoicing software, because quotes in the CRM (the software where you keep contacts, leads and jobs) aren't paid revenue. Reports also get recalculated at the end of the month, so a first look is a draft.
Test new ideas on their own line
Give a new offer its own line. At one company, event sign-ups cost about $43 each, against about $100 for a regular lead. Even the ones who didn't show up were still leads who could be called. At another company, a package offer brought in only three leads for the money, and each cost a bit more than a regular lead. The question was whether to continue.
The same test works for an outside offer. A vendor offered one company a booked job at $75. The company was already getting booked jobs at about $52 across its channels. Now they had a number to argue with. Another partner campaign cost about $37 per lead, 53 leads for about $2,000, and was judged by cost per lead against the value of the estimate.
You will not know exactly
You'll never know exactly which lead came from where. When Facebook, Google and a third source all run at once, I call it the three-body problem: three things pull on each other, and you can't always tell which pulled which. Customers also say "Google" and mean ads, Maps or LSA. Chapters 3 and 4 show how to get this good enough to make decisions with.
Questions owners brought me
These are real questions, paraphrased, with the short answer I can give from my meetings.
Is $300 per lead too much? It depends on what you close and what you keep. In one saturated market, leads at $170 converted well. See "Where your own limit comes from" earlier in this chapter.
We pay $2,400 per appointment. Is that normal? At one company, marketing counted an appointment at under $500 and the owner, counting staff, at $1,200. Judge it by the cost of a paid job.
We paid a lead-gen vendor $20 per lead. Out of eight, one bought. Is that okay? Eight leads at $20 is $160 for one customer. Compare that with what one customer is worth to you.
I paid $350 for ten calls. Should the maximum be $80? That's $35 per call. What it costs per customer depends on how many calls close. At one in two, for illustration, it's $70.
A call costs $35, but we close 60 to 70%. If you close six of ten calls, $35 per call is about $58 per customer.
Only 13 leads and 4 bought. Is that real? Small numbers jump around. I look for months of data before I compare two sources. Chapter 5 has a section on telling noise from a real change.
What to do on Monday
Ask for one table. For the last thirty days, one row for every source:
- spend,
- leads,
- cost per lead,
- booked jobs or estimates,
- cost per booked job,
- paid jobs,
- cost per paid job,
- money that came in, and dollars back per dollar spent.
Add a column called "still open" for leads and estimates that are still pending.
The table has one job: to answer where next month's money goes. At one company the owner doubted marketing because nobody knew how well each source converted, so nobody could say where to put more money. I told the team that in a month we should have a table exactly like this one. At one company, half of that table was blank for the first two months, and then the picture came together.
With the table in front of you:
- For each source, divide the spend by the jobs that were done and paid for. Read that number, the cost per paid job, before you read the cost per lead.
- Split your biggest sources by service, so one blended number doesn't hide a service that loses money.
- Work out your own limit for a lead from what you keep on a job and how many leads you close.
- Before you raise a budget, test small, and scale only when the money comes back.
- Before you cut a source or blame the ads, ask what happens after the lead: who answered, who sold, how many estimates closed.
- Agree on how to count, and ask what the month would look like without its one biggest job.
The chapter in five lines
- A platform sells you leads. You live on paid jobs, so judge every source by the cost of a paid job, split by service.
- A high lead price can be a good deal, and a low one can be the most expensive job you buy. Your limit comes from your margin and your close rate.
- Put your money where the fish are biting, test small first, and compare markets by return, not by lead count.
- Before you blame the ads, ask what happens after the lead. Judge the money after the lag, over a window of months, because one big job or a referral can fool you.
- Agree on how to count, test every new offer on its own line, and keep one table with one question: where does next month's money go?
Liked it? Get the rest first.
Know to Grow is two books. Book 1 is about your numbers and turning leads into paid jobs. Book 2 explains how each channel really works.